Archive

Monthly Archives: March 2019

First, let me present the numbers:

Date Opponent-Location (from the opponent’s perspective) Bubble EW% WAB Result
11/09/18 UT Rio Grande Valley-Home 0.8114 0.1886
11/12/18 UTSA-Home 0.7374 0.2626
11/18/18 Wofford-Away 0.5298 0.4702
11/21/18 Florida-Neutral 0.4072 0.5928
11/22/18 Wisconsin-Neutral 0.2465 -0.2465
11/23/18 Dayton-Neutral 0.6172 0.3828
11/27/18 North Texas-Away 0.9136 0.0864
12/04/18 Notre Dame-Neutral 0.6734 0.3266
12/08/18 Wichita St.-Semi-Away 0.7885 0.2115
12/15/18 USC-Away 0.8146 0.1854
12/18/18 Creighton-Away 0.6753 0.3247
12/21/18 Northwestern-Home 0.5020 0.4980
01/02/19 Kansas-Home 0.1805 -0.1805
01/05/19 Oklahoma St.-Away 0.7919 0.2081
01/08/19 Texas Tech-Home 0.1039 -0.1039
01/12/19 TCU-Away 0.6461 0.3539
01/16/19 Kansas St.-Away 0.4673 -0.4673
01/19/19 Texas-Home 0.2625 -0.2625
01/23/19 Oklahoma St.-Home 0.5121 0.4879
01/26/19 Vanderbilt-Away 0.8944 0.1056
01/28/19 Baylor-Away 0.6289 -0.6289
02/02/19 West Virginia-Home 0.5462 -0.5462
02/04/19 Iowa St.-Away 0.4995 -0.4995
02/09/19 Texas Tech-Away 0.2959 -0.2959
02/11/19 Baylor-Home 0.3185 -0.3185
02/16/19 TCU-Home 0.3349 0.6651
02/23/19 Texas-Away 0.5635 0.4365
02/25/19 Iowa St.-Home 0.2159 -0.2159
03/02/19 West Virginia-Away 0.8136 0.1864
03/05/19 Kansas-Away 0.4440 0.5560
03/09/19 Kansas St.-Home 0.1948 -0.1948
03/13/19 West Virginia-Neutral 0.6962 -0.6962
Net WAB 1.8725

I’m not sure why they opened up their season with a couple road games against UTRGV and UTSA. Oklahoma ended up going 11-1 in their non-conference slate. That’s a solid result, but their weren’t any huge scalps. Florida on a neutral court was their best win. They followed up by going 7-11 in the Big 12, before losing to West Virginia in the first round of the conference tournament. How does WAB view this?

Out of Conference 3.28
Vs. the Big 12 -1.41

We’d expect an average bubble team to go roughly 8-4 vs. Oklahoma’s non-conference schedule. Going 11-1 there was an exceptional result. Finishing 7-12 vs. the Big 12 wasn’t great. The expected result was roughly 8.6-10.4, which is to say we’d expect an average bubble team to have a losing record against the teams Oklahoma faced. Their schedule was brutal.

Overall Oklahoma is roughly two wins ahead of what we’d expect from a bubble team facing their schedule. 19-13 might not be impressive on its own, but when 17.1-14.9 is the baseline, 19-13 starts looking fantastic. Oklahoma deserves an at-large bid to the dance.

Now that UNC Greensboro have finished their regular season and their conference tournament, their NCAA Tournament resume is complete. I am going to discuss them through the lens of Parcells, where they have the 32nd best overall resume. However, before I get to that, I’d like to cover a pair of other resume rankings that are publicly available.

ESPN’s BPI SOR is a WAB-style measure, but with a baseline of a top-25 team. It has UNC Greensboro with the 32nd overall best resume:

http://www.espn.com/mens-college-basketball/bpi/_/view/resume

ESPN’s BPI SOR is on the team sheets available to the committee. It is both the best, and the only, resume ranking tool on the team sheets.

Bart Torvik’s T-Rank has them with the 33rd best WAB:

http://www.barttorvik.com/?sort=34&begin=20181101&end=20190501&conlimit=All&top=0&hteam=&quad=5&rpi=#

Bart’s site has a staggering amount of information and it’s worth spending a few minutes clicking around and checking it out.

It seems like there is reasonable agreement as to whether UNC Greensboro’s resume is worthy of inclusion to the dance, but not so fast. Let’s look at some of the information that will be on their team sheet:

UNCG

That is what the committee will be looking at in the meeting room. Let’s start at the top:

28-6. Solid.

Net: 58. Not great. The NET is a hybrid measure that is both predictive and descriptive. In short, it is partially predictive, so it measures how good you are in addition to how strong your resume is.

KPI: 58. KPI is an algorithm designed to mimic and predict the committee. The switch from RPI to NET might render it a bit anachronistic.

SOR: 32: Generated from ESPN’s BPI. As I noted above, it is the only resume rating on this sheet.

BPI: 77. ESPN’s ranking for UNC Greensboro. This is a predictive measure that judges how good they are, and is not a measure for how strong their resume is.

Pom: 81. The KenPom ranking for UNC Greensboro. This is a predictive measure that judges how good they are, and is not a measure for how strong their resume is.

Sag: 87. The Sagarin ranking for UNC Greensboro. This is a predictive measure that judges how good they are, and is not a measure for how strong their resume is.

The average NET win and average NET loss are two of the silliest statistics I’ve ever seen. Moving right along, let’s skip to the meat of the sheet: the four quadrants:

The first quadrant is broken down into two parts. UNC Greensboro went 0-5 against the elite quadrant one opponents, and 2-1 vs. the lower half of quadrant one. UNC Greensboro went 2-0 vs. quadrant two opponents, 6-0 vs. quadrant three opponents, and 16-0 vs. quadrant four opponents. How does this look from a WAB perspective?

Opponent-Location (from the opponent’s perspective) bubb win% WAB Quad
Kentucky-Home 0.1011 -0.1011 1
LSU-Home 0.1913 -0.1913 1
Wofford-Home 0.2471 -0.2471 1
Wofford-Neutral 0.3846 -0.3846 1
Wofford-Away 0.5434 -0.5434 1
Furman-Home 0.4542 -0.4542 1
East Tennessee St.-Home 0.5274 0.4726 1
Furman-Neutral 0.6131 0.3869 1
Furman-Away 0.7511 0.2489 2
East Tennessee St.-Away 0.8018 0.1982 2
Samford-Home 0.7491 0.2509 3
Louisiana Tech-Neutral 0.8265 0.1735 3
Samford-Neutral 0.8504 0.1496 3
Radford-Away 0.8884 0.1116 3
Mercer-Home 0.8286 0.1714 3
Samford-Away 0.8907 0.1093 3
Delaware-Home 0.9154 0.0846 4
Chattanooga-Home 0.8973 0.1027 4
Mercer-Away 0.946 0.054 4
The Citadel-Home 0.902 0.098 4
UNC Wilmington-Home 0.9039 0.0961 4
Western Carolina-Home 0.9211 0.0789 4
VMI-Home 0.9262 0.0738 4
Prairie View A&M-Away 0.9634 0.0366 4
Elon-Home 0.9335 0.0665 4
North Carolina A&T-Home 0.9409 0.0591 4
Chattanooga-Away 0.9694 0.0306 4
The Citadel-Away 0.9709 0.0291 4
Western Carolina-Away 0.9769 0.0231 4
VMI-Away 0.9785 0.0215 4
North Alabama-Away 0.9834 0.0166 4
Coppin St.-Away 0.9949 0.0051 4
Johnson & Wales NC-Away 1 0 x
Greensboro-Away 1 0 x
Net WAB: 1.2275

Please note, the locations listed above are where the opponent was playing. Kentucky and LSU hosted UNC Greensboro.

UNC Greensboro struggled against their elite competition, but beat everyone else. Let’s look at their WAB by quad:

Quad: WAB
1 -1.0622
2 0.4471
3 0.9663
4 0.8763
Net WAB: 1.2275

Should a bubble team have put up a better showing against quad one? Yes. An average bubble team would’ve expected to be 3-5. UNC Greensboro only won twice. However, an average bubble team would have expected to pick up 2-3 losses over the rest of the schedule. Our prospective bubble squad would expect to go undefeated in those 24 games only 8.37% of the time. Going 24-0 here is an impressive accomplishment.

Let’s compare them to a team listed among Eamonn Brennan’s locks: Baylor.

Baylor

Baylor is on all 138 of the http://www.bracketmatrix.com brackets, so it’s reasonable to consider them a lock.

Wins over Texas Tech, Iowa St., Texas, Oklahoma, TCU, Alabama, Oregon. Why are we still talking about them? Well, it’s because their resume isn’t actually better than UNC Greensboro’s. Really:

Opponent-Location (from the opponent’s perspective) bubb win% WAB Quad
Mississippi-Neutral 0.4773 -0.4773 1
Kansas St.-Away 0.4738 -0.4738 1
Kansas-Away 0.4489 -0.4489 1
TCU-Home 0.3393 -0.3393 1
Texas-Home 0.2666 -0.2666 1
Kansas St.-Home 0.1989 -0.1989 1
Kansas-Home 0.1834 -0.1834 1
Texas Tech-Home 0.1059 -0.1059 1
Iowa St.-Home 0.2196 0.7804 1
Oklahoma-Home 0.2864 0.7136 1
Texas Tech-Away 0.3005 0.6995 1
Iowa St.-Away 0.505 0.495 1
Wichita St.-Home 0.5911 -0.5911 2
Oklahoma St.-Home 0.519 0.481 2
Arizona-Home 0.532 0.468 2
Texas-Away 0.5686 0.4314 2
West Virginia-Home 0.5701 0.4299 2
Oklahoma-Away 0.5927 0.4073 2
TCU-Away 0.6506 0.3494 2
Oregon-Away 0.6992 0.3008 2
Alabama-Away 0.7219 0.2781 2
Oklahoma St.-Away 0.7964 -0.7964 3
West Virginia-Away 0.8279 0.1721 3
George Mason-Neutral 0.8396 0.1604 3
Stephen F. Austin-Away 0.9826 -0.9826 4
Texas Southern-Away 0.9591 -0.9591 4
South Dakota-Away 0.96 0.04 4
Prairie View A&M-Away 0.9634 0.0366 4
New Orleans-Away 0.9709 0.0291 4
Nicholls St.-Away 0.9853 0.0147 4
Southern-Away 0.9926 0.0074 4
Net WAB: 0.4714

Again, let’s break it down by quadrant:

Quad: WAB
1 0.1944
2 2.5548
3 -0.4639
4 -1.8139
Net WAB: 0.4714

Baylor paid the bills by going 8-1 against quadrant two. However, they also pulled in three losses vs. quadrants three and four. Just looking at quadrant four, a bubble team would expect to go undefeated 82.76% of the time. Baylor lost twice. Those games count too. Yes, Baylor’s resume is probably worthy of inclusion to the dance, but overall it isn’t better than UNC Greensboro’s.

Mind you, Baylor is better than UNC Greensboro:

Team Pythag
UNC Greensboro 74.59%
Baylor 87.73%

If they were to play on a neutral court, I’d expect Baylor to win 71% of the time. But, their resumes?

Team Parcells
UNC Greensboro 90.19%
Baylor 87.70%

Baylor’s record is exactly what we would expect from them. UNC Greensboro’s record is far beyond what we would expect from them. The thing is, they won the games. If our WAB baseline was .9019, Baylor would have a WAB of -1.28.

If we care about which teams have the best bodies of work, UNC Greensboro deserves an at-large bid to the NCAA Tournament.


“You are what your record says you are.” -Bill Parcells

In the world of college basketball, it’s a bit more complicated. Teams play wildly disparate schedules. Abilene Christian and Michigan State are both 23-6. We know that Michigan State has played a tougher schedule than Abilene Christian, but can we quantify that difference? Yes, but let me first define a few terms:

Pythag: Pythag (short for Pythagorean Win Expectation) is your expected win percentage against an average D1 team on a neutral court.

Parcells: The Pythag required for your record to be the median expectation. It’s quite literally what your record says you are.

WAB: Wins-Above-Bubble. The amount of wins you have minus the amount of wins an average bubble team would expect vs. your schedule.

You can find all the data available here:

https://docs.google.com/spreadsheets/d/1qmdUR_iMWIUzMBQvMwGBP-EV_64f59kaGUOVUAiKO60/edit?usp=sharing

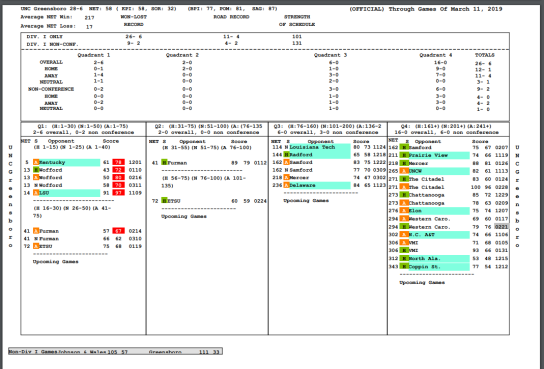
Abilene Christian went 0-1 in quadrant one games, 0-0 in quadrant two games, 2-2 in quadrant three games, and 17-3 in quadrant four games. They also went 4-0 in games not rated by the NCAA.

Michigan State went 10-4 in quadrant one games, 4-2 in quadrant two games, 5-0 in quadrant three games, and 4-0 in quadrant four games.

Abilene Christian played one very tough game this season, at Texas Tech. They lost by 34. The question remains: can we quantify the difference between the two resumes? The answer is yes.

We have a few different tools at our disposal. One option is to put hypothetical team through both schedules and see how many games they would expect to win. So, just how hard has Michigan State’s schedule been? If you put roughly the 50th best team in the country against their schedule, they’d be expected to win about 15.12 games. That’s an expected record of 15.12 wins and 13.88 losses. It really is an absurdly tough schedule.

How about we put the 50th best team in the country against Abilene Christian’s schedule? We’d expect them to produce a record of 26.50 wins and 2.50 losses. In short, Abilene Christian would need to be 28-1 to be in the discussion for an at-large bid, presuming they don’t win their conference tournament.

The methodology I outlined about is Wins-Above-Bubble, or WAB. WAB can be calculated with any set of ratings. I run WAB for the KenPom’s, Sagarin Predictor, and Massey Power daily. It’s fairly straightforward: how many wins do you have? How many wins would a bubble team average against your schedule? The difference is your WAB. Michigan State and Abilene Christian are both 23-6, but Michigan State’s WAB is 11.38 wins clear of Abilene Christian. However, you’ll note Abilene Christian only has six losses. Even had they ran the table, they’d only generate 2.5 Wins-Above-Bubble.

Gonzaga trails Michigan State in the WAB standings by 1.1 wins. Despite that, they are in line for the #1 seed out West. There are a few reasons for this. First, they have a neutral court win over Duke. Second, on a possession-by-possession basis they have been one of the best teams in the country. Abilene Christian has not been one of the best teams in the country.

The NCAA Tournament Selection Committee has something of a dual mandate. They are tasked with selecting the best 36 at-large teams in the country, and seeding the 68 qualifiers. They are also asked to select basis on the best resumes, or “bodies of work.” If we are going by wins and losses, these are two separate things.

“If you rank teams by how good they are then it doesn’t matter who wins games. A buzzer beater in a conference tournament will be effectively irrelevant. A sport needs its wins and losses to matter.” -Jeff (@Bpredict on Twitter)

If we are to select and seed teams, by their resumes, we need to be able to accurately judge those resumes. To be able to do that, we’d need a way of solving for how impressive a record is. WAB isn’t bad. It gives us a quick and simple way of looking at how many wins you have relative to what should be expected of you. It isn’t perfect though. It doesn’t translate into Pythag.

Pythag (short for Pythagorean Win Expectation) is your expected win percentage against an average D1 team on a neutral court. This year, we have three historical monsters as far as Pythag is concerned: Duke, Gonzaga, and Virginia. Pythag is a predictive rating, formed by your level of dominance on a possession-by-possession basis. As far as Pythag is concerned, whether a last second shot to win the game goes in or not is a tiny blip on your rating. It’s merely one possession out of a couple thousand over the course of a season. Of course, that possession can have a massive effect on your resume.

Last year I took a stab at translating a resume into Pythag. That’s a tricky thing. To solve for that, you need to figure out how good a team would have to be to expect to generate their record. Adam (@cajuncooks on Twitter) was able to program a solution to this problem. Let’s look back at Michigan State.

A team with a Pythag of .9719 projects to have five or fewer losses vs. that schedule 39.95% of the time. They’d have six losses 20.09% of the time. They have seven or more losses 39.96% of the time. Yes, there is some rounding going on here, so please trust me when I say that if we had more significant digits the two batches of results would be equally likely.

I know that got a little complicated, so let me simplify: .9719 is what Michigan State’s record says they are. .9719 is what their body of work implies about them. I originally named this metric Implied Pythag, but I have since renamed it Parcells since this is what their record says they are. Interestingly, they’ve been better that on a possession-by-possession basis, producing a Pythag of .9786.

Thanks to Adam’s expertise, I can produce the Parcells rating for every team playing D1 basketball. Which brings me to UNC Greensboro. They are not one of the 36 best at-large teams in the country. They are 87th in KenPom, 103rd in Sagarin Predictor, and 74th in Massey’s power. Blending the three together, I have them as the 89th best team in the country. Yet, they’ve produced an average WAB of 1.04. Penn State is in the KenPom top 50. Saint Mary’s is in the KenPom top 40. I have them with -2.80, and -2.57 WAB respectively.

Penn State and St. Mary’s are better than UNC Greensboro. Their resumes are quite a bit worse though. Penn State has produced a Parcells of .7911. St. Mary’s has a Parcells of .7827. UNC Greensboro has produced a Parcells of .9022. Yes, you really would have to be that good to expect to go 26-5 against that schedule.

As per the KenPom’s the Southern Conference is roughly equal to the Atlantic 10. This year, the Southern merits multiple bids, regardless of who wins their conference tournament. However, if Wofford wins, we might not see UNC Greensboro rewarded for their sterling resume. UNC Greensboro is 58th in the NET rankings. St. Mary’s is 39th. As I noted before, St. Mary’s is better than UNC Greensboro. UNC Greensboro has a better body of work. It’s up to the committee to decide what they want to reward.

I’ve touched briefly on the NET Rankings. NET is quite different from RPI. RPI was 75% a measure of strength of schedule. NET is clearly designed to be predictive, but with descriptive elements and inputs. In short, it is a hybrid rating. Of course, the committee may use NET purely as a sorting tool. I rarely pay attention to the NET rankings because they aren’t relevant to the questions I am trying to answer. What I want to know:

How good you are? That’s your Pythag rating.

How good is your resume? That’s Parcells.

How many wins do you have relative to an average bubble team? That’s your WAB.

I don’t need to squint at two wildly different team sheets and try to parse which is better. I want to solve for that. Some teams get multiple quadrant one opportunities at home. Others get very few. If quadrant one and two wins are the currency that merits inclusion to the dance, power conferences will be incentivized to hoard them and play as many conference games as possible. Interestingly, the NET doesn’t punish a soft out-of-conference schedule the way the RPI did.

As for arbitrary cutoffs:

https://twitter.com/JohnGasaway/status/1102228507445415938

The committee is going to do what the committee is going to do. If they want the 36 best at-large teams, the KenPoms and such are a good guide. If they want the 36 best at-large resumes, Parcells answers that question.